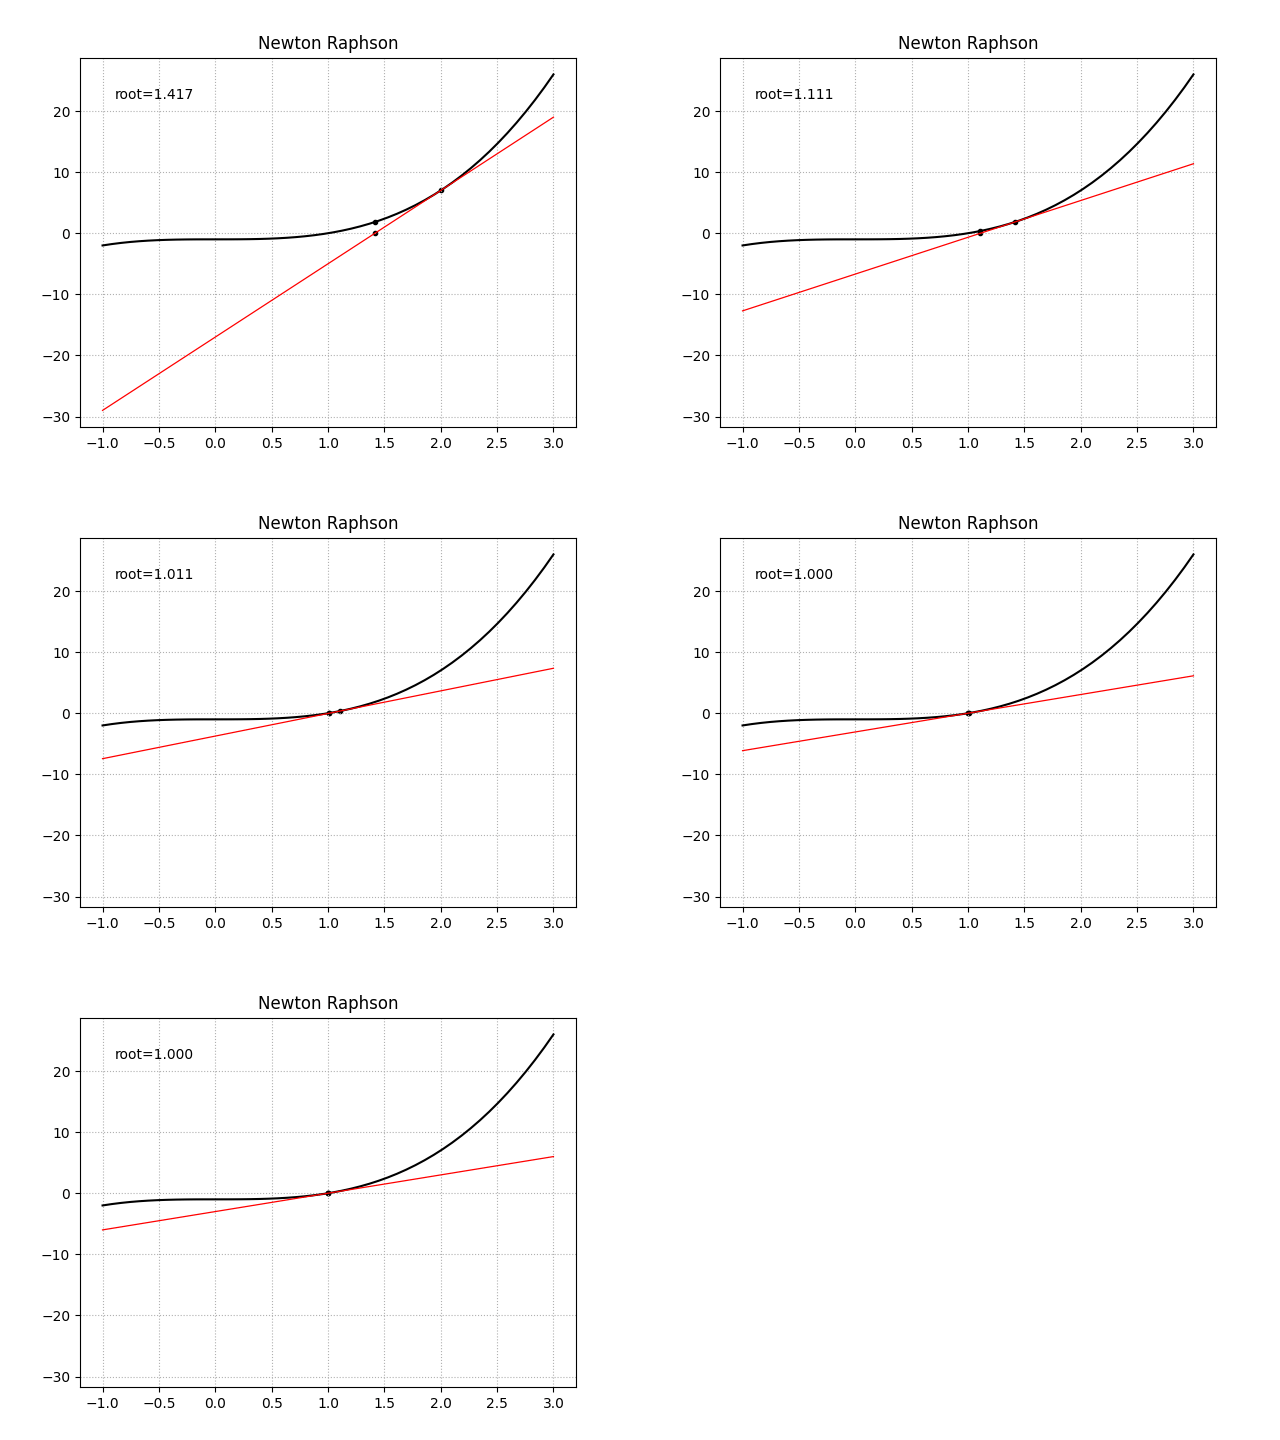
Newton-Raphson
牛顿法是凸优化理论中一种经典的数值优化算法,通过生成一系列$x_n$来从起始猜测点$x_0$找到函数$f$的根$\alpha$,这个起始猜测点$x_0$应该距离真实的根$\alpha$足够近以使得结果可以收敛。首先对函数$f$在点$x_0$处做切线,通过计算切线的根我们得到了$\alpha$的一个近似估计,重复这个过程我们就得到了序列$x_n$。对于一个函数$f(x)$它在点$x_0$处的泰勒展开为:
\[f(x) = \frac {f(x_0)} {0!} + \frac {f'(x_0)} {1!} (x - x_0) + \frac {f''(x_0)} {2!} (x - x_0)^2 + ... + \frac {f^{(n)}(x_0)} {n!} (x - x_0)^n + R_n(x)\]我们取泰勒展开公式的前两项,并使用拉格朗日余项
\[f(x) = f(x_0) + f'(x_0) (x - x_0) + \frac {f''(\xi)} 2 (x - x_0)^2, \quad \xi \in (x_0, x)\]假设$x = \alpha$,此时$f(\alpha) = 0$,有
\[\alpha = x_0 - \frac {f(x_0)} {f'(x_0)} - \frac {(\alpha - x_0)^2} 2 \frac {f''(\xi)} {f'(x_0)}\]忽略上式的最后一项,我们得到了牛顿法的迭代公式
\[x_{n+1} = x_n - \frac {f(x_n)} {f'(x_n)}\]同时也得到了牛顿法的估计偏差
\[\alpha - x_{n+1} = - \frac {(\alpha - x_n)^2} 2 \frac {f''(\xi)} {f'(x_n)}\]定理:对于一个向$x^*$收敛的序列$x_n$,如果存在
\[\lim_{n \to \infty} \frac {\vert x_{n+1} - x^* \vert} {\vert x_n - x^* \vert ^q} = \mu\]则称该序列为$q$阶收敛的,收敛速率为$\mu$。
假设$f(x)$,$f^{\prime}(x)$,$f^{\prime\prime}(x)$在根$\alpha$附近是连续的,且$f^{\prime}(\alpha) \neq 0$,于是
\[\lim_{n \to \infty} \frac {\alpha - x_{n+1}} {(\alpha - x_n)^2} = - \frac {f''(\alpha)} {2f'(\alpha)}\]由上面的定理,Newton-Raphson方法是平方收敛的。
一阶导函数已知时

import numpy as np
from matplotlib import pyplot as plt
from matplotlib.animation import ArtistAnimation


def newton_raphson(func, fprime, x0, a, b, epsilon=1e-5):
    """
    当目标函数的一阶导函数形式已知时可使用本方法

    Parameters
    ----------
    func : callable
        The function whose zero is wanted. It must be a function of a
        single variable of the form ``f(x)``.
    fprime : callable
        The derivative of the function when available and convenient.
    x0 : float
        An initial estimate of the zero that should be somewhere near the
        actual zero.
    a : float
        The minimum value of ``x`` in the plot.
    b : float
        The maximum value of ``x`` in the plot.
    epsilon: float
        The allowable error of the zero value.

    Returns
    -------
    root : float
        Estimated location where function is zero.
    """
    x = np.linspace(a, b)
    y = func(x)
    root = x0

    fig, ax = plt.subplots()
    ax.grid(linestyle=':')
    ax.set_title('Newton Raphson')
    ax.plot(x, y, color='k')

    artists = []
    while abs(func(root)) > epsilon:
        slope = fprime(root)  # 该点处曲线的斜率
        tangent = slope * (x - root) + func(root)  # 该点处曲线的切线
        artist = ax.plot(x, tangent, linewidth=.9, color='r')  # 画出切线
        artist.append(ax.scatter(root, func(root), color='k', marker='.'))  # 画出切点
        root = (slope * root - func(root)) / slope  # 切线的根
        artist.append(ax.scatter(root, 0, color='k', marker='.'))  # 画出切线的根
        artist.append(ax.scatter(root, func(root), color='k', marker='.'))  # 画出切线根处的曲线取值
        artist.append(ax.text(.15, .9, f'{root=:.3f}', horizontalalignment='center', verticalalignment='center', transform=ax.transAxes))
        artists.append(artist)
    ani = ArtistAnimation(fig, artists, interval=1000)
    ani.save('Newton Raphson.gif')
    plt.close(fig)
    return root
一阶导函数未知时
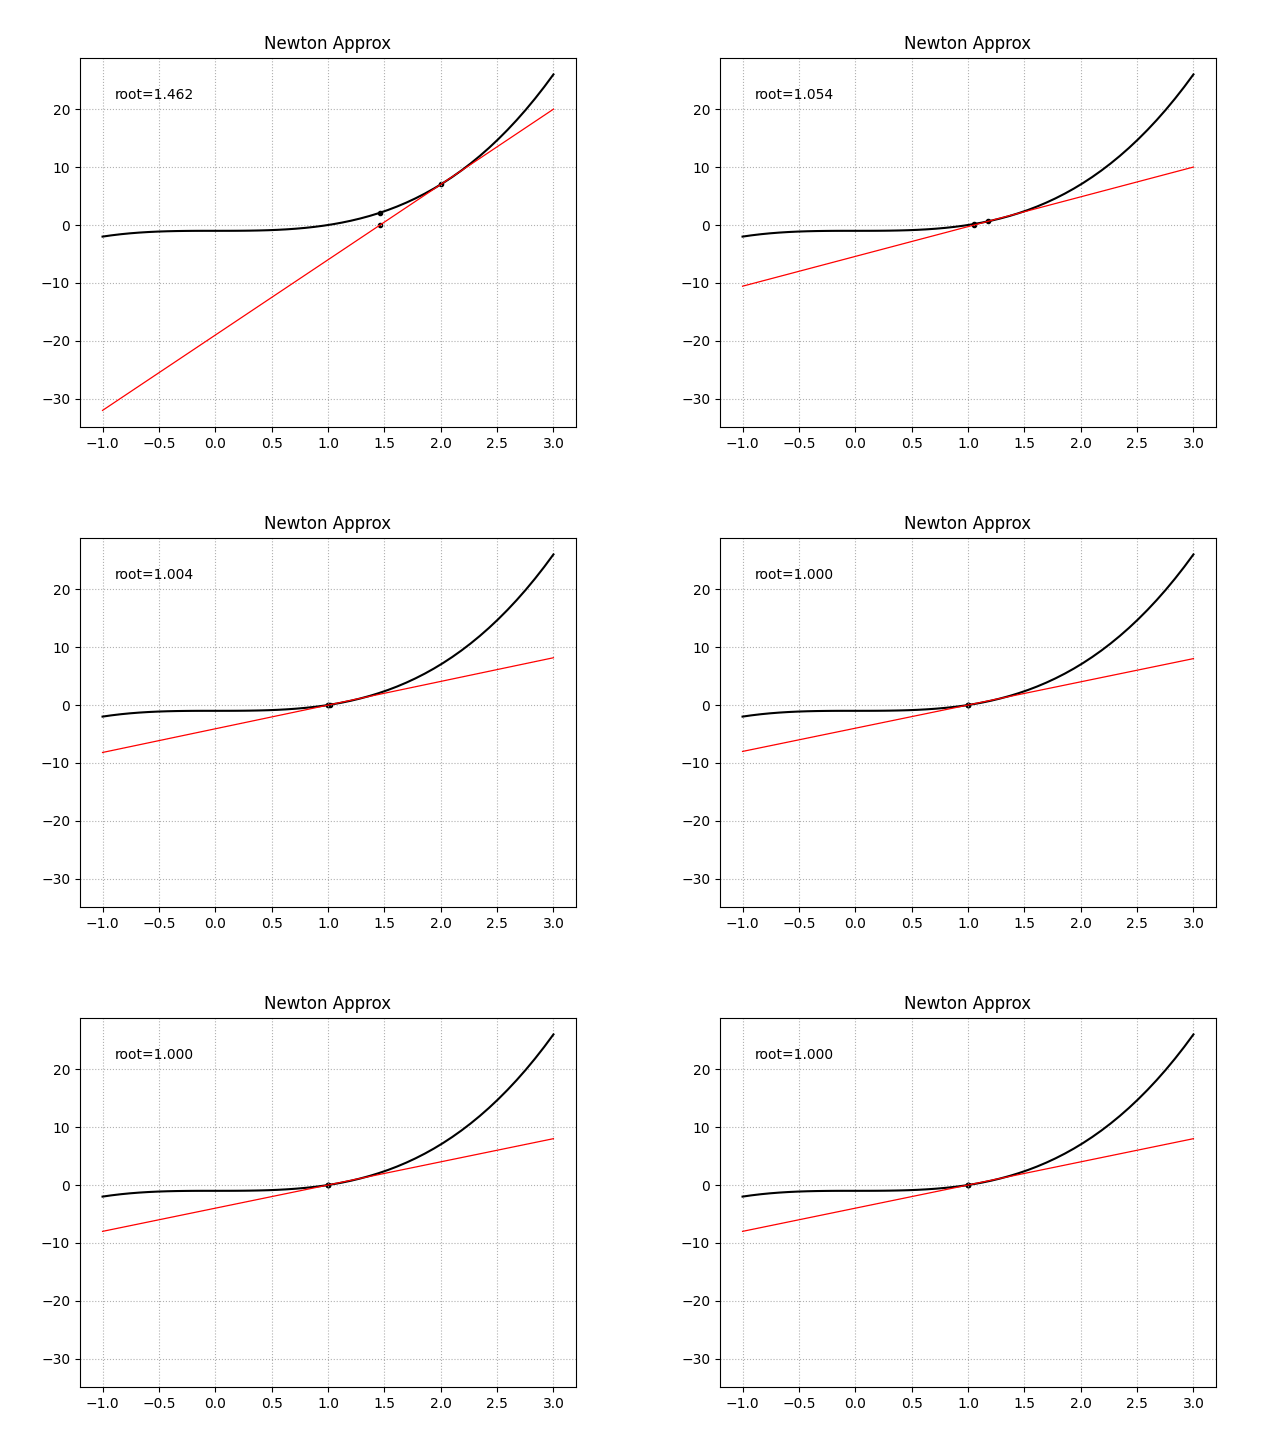
此时可以尝试使用中心差分法来对目标函数在某点处的一阶导数值进行近似数值求解
\[f'(x_0) = \frac {f(x_0 + h) - f(x_0 - h)} {2h}\]
import numpy as np
from matplotlib import pyplot as plt
from matplotlib.animation import ArtistAnimation
from scipy.misc import derivative


def newton_approx(func, x0, a, b, epsilon=1e-5):
    """
    当目标函数的一阶导函数形式未知时,使用中心差分法进行数值求导

    Parameters
    ----------
    func : callable
        The function whose zero is wanted. It must be a function of a
        single variable of the form ``f(x)``.
    x0 : float
        An initial estimate of the zero that should be somewhere near the
        actual zero.
    a : float
        The minimum value of ``x`` in the plot.
    b : float
        The maximum value of ``x`` in the plot.
    epsilon: float
        The allowable error of the zero value.

    Returns
    -------
    root : float
        Estimated location where function is zero.
    """
    x = np.linspace(a, b)
    y = func(x)
    root = x0

    fig, ax = plt.subplots()
    ax.grid(linestyle=':')
    ax.set_title('Newton Approx')
    ax.plot(x, y, color='k')

    artists = []
    while abs(func(root)) > epsilon:
        slope = derivative(func, root)  # 该点处曲线的斜率
        tangent = slope * (x - root) + func(root)  # 该点处曲线的切线
        artist = ax.plot(x, tangent, linewidth=.9, color='r')  # 画出切线
        artist.append(ax.scatter(root, func(root), color='k', marker='.'))  # 画出切点
        root = (slope * root - func(root)) / slope  # 切线的根
        artist.append(ax.scatter(root, 0, color='k', marker='.'))  # 画出切线的根
        artist.append(ax.scatter(root, func(root), color='k', marker='.'))  # 画出切线根处的曲线取值
        artist.append(ax.text(.15, .9, f'{root=:.3f}', horizontalalignment='center', verticalalignment='center', transform=ax.transAxes))
        artists.append(artist)
    ani = ArtistAnimation(fig, artists, interval=1000)
    ani.save('Newton Approx.gif')
    plt.close(fig)
    return root
Halley
当目标函数的自变量为一维,并且三阶可导且连续,同时它的根与它的各阶导函数的根均不同时,考虑方程
\[g(x) = \frac {f(x)} {\sqrt{\vert f'(x) \vert}}\]于是
\[g'(x) = \frac {2[f'(x)]^2 - f(x)f''(x)} {2f'(x)\sqrt{\vert f'(x) \vert}}\]对于目标函数$g(x)$,由Newton-Raphson法可得
\[x_{n+1} = x_n - \frac {g(x_n)} {g'(x_n)}\]
import numpy as np
from matplotlib import pyplot as plt
from matplotlib.animation import ArtistAnimation


def halley(func, fprime, fprime2, x0, a, b, epsilon=1e-5):
    """
    当目标函数的一阶与二阶导函数形式均已知时可使用本方法

    Parameters
    ----------
    func : callable
        The function whose zero is wanted. It must be a function of a
        single variable of the form ``f(x)``.
    fprime : callable
        The derivative of the function when available and convenient.
    fprime2 : callable
        The second order derivative of the function when available and
        convenient.
    x0 : float
        An initial estimate of the zero that should be somewhere near the
        actual zero.
    a : float
        The minimum value of ``x`` in the plot.
    b : float
        The maximum value of ``x`` in the plot.
    epsilon: float
        The allowable error of the zero value.

    Returns
    -------
    root : float
        Estimated location where function is zero.
    """
    def g(z):
        return func(z) / np.sqrt(np.abs(fprime(z)))

    def g_grad(z):
        return (2 * fprime(z) ** 2 - func(z) * fprime2(z)) / (2 * fprime(z) * np.sqrt(np.abs(fprime(z))))

    x = np.linspace(a, b)
    y = g(x)
    root = x0

    fig, ax = plt.subplots()
    ax.grid(linestyle=':')
    ax.set_title('Halley')
    ax.plot(x, y, color='k')

    artists = []
    while abs(g(root)) > epsilon:
        slope = g_grad(root)  # 该点处曲线的斜率
        tangent = slope * (x - root) + g(root)  # 该点处曲线的切线
        artist = ax.plot(x, tangent, linewidth=.9, color='r')  # 画出切线
        artist.append(ax.scatter(root, g(root), color='k', marker='.'))  # 画出切点
        root = (slope * root - g(root)) / slope  # 切线的根
        artist.append(ax.scatter(root, 0, color='k', marker='.'))  # 画出切线的根
        artist.append(ax.scatter(root, g(root), color='k', marker='.'))  # 画出切线根处的曲线取值
        artist.append(ax.text(.15, .9, f'{root=:.3f}', horizontalalignment='center', verticalalignment='center', transform=ax.transAxes))
        artists.append(artist)
    ani = ArtistAnimation(fig, artists, interval=1000)
    ani.save('Halley.gif')
    plt.close(fig)
    return root
正割法
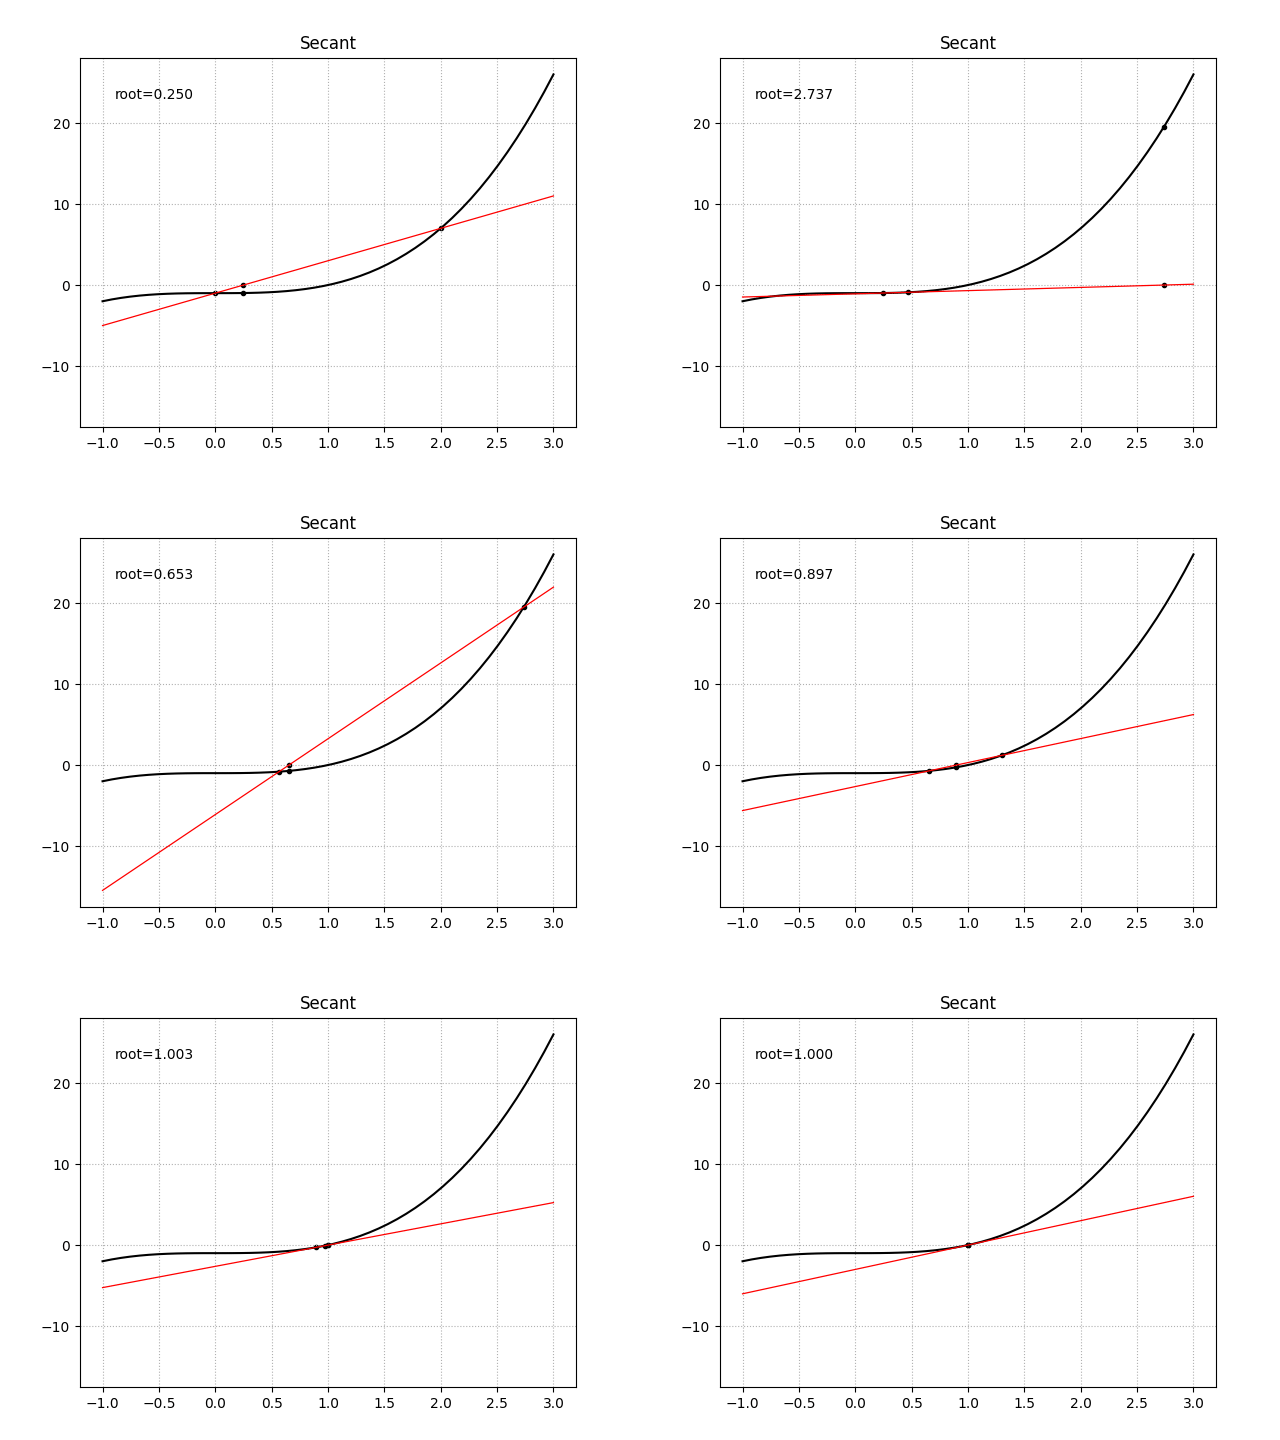
当目标函数的一阶导函数形式未知时,相对于使用中心差分法来做数值求导,还存在一种更为精确求根的方法。对于目标函数$f(x)$上的两点$x_0$、$x_1$,存在一条割线穿过两点,它的函数形式定义为
\[y = \frac {f(x_1) - f(x_0)} {x_1 - x_0} (x_1 - x_0) + f(x_1)\]割线的根为
\[x = x_1 - f(x_1) \frac {x_1 - x_0} {f(x_1) - f(x_0)}\]于是得到迭代公式
\[x_n = x_{n-1} - f(x_{n-1}) \frac {x_{n-1} - x_{n-2}} {f(x_{n-1}) - f(x_{n-2})}\]
import numpy as np
from matplotlib import pyplot as plt
from matplotlib.animation import ArtistAnimation


def secant(func, x0, x1, a, b, epsilon=1e-5):
    """
    正割法,当目标函数的一阶导函数形式未知时可使用本方法

    Parameters
    ----------
    func : callable
        The function whose zero is wanted. It must be a function of a
        single variable of the form ``f(x)``.
    x0 : float
        An initial estimate of the zero that should be somewhere near the
        actual zero.
    x1 : float
        Another estimate of the zero that should be somewhere near the
        actual zero.
    a : float
        The minimum value of ``x`` in the plot.
    b : float
        The maximum value of ``x`` in the plot.
    epsilon: float
        The allowable error of the zero value.

    Returns
    -------
    root : float
        Estimated location where function is zero.
    """
    x = np.linspace(a, b)
    y = func(x)
    root = 999

    fig, ax = plt.subplots()
    ax.grid(linestyle=':')
    ax.set_title('Secant')
    ax.plot(x, y, color='k')

    artists = []
    while abs(func(root)) > epsilon:
        secant = ((x1 - x) * func(x0) + (x - x0) * func(x1)) / (x1 - x0)  # 曲线的割线
        artist = ax.plot(x, secant, linewidth=.9, color='r')  # 画出割线
        artist.append(ax.scatter([x0, x1], [func(x0), func(x1)], color='k', marker='.'))  # 画出交点
        root = x1 - func(x1) * (x1 - x0) / (func(x1) - func(x0))  # 割线的根
        artist.append(ax.scatter(root, 0, color='k', marker='.'))  # 画出割线的根
        artist.append(ax.scatter(root, func(root), color='k', marker='.'))  # 画出割线根处的曲线取值
        artist.append(ax.text(.15, .9, f'{root=:.3f}', horizontalalignment='center', verticalalignment='center', transform=ax.transAxes))
        artists.append(artist)
        x0, x1 = x1, root
    ani = ArtistAnimation(fig, artists, interval=1000)
    ani.save('Secant.gif')
    plt.close(fig)
    return root


